Analysis of Ground Observatory data#
VirES also has ground observatory data from INTERMAGNET (via the “AUX_OBS” collections). We can apply the same TFA tools to this data.
For more details, see the viresclient documentation and the AUX_OBS demo notebook
import datetime as dt

from swarmpal.io import create_paldata, PalDataItem
from swarmpal.toolboxes import tfa
Fetching data#
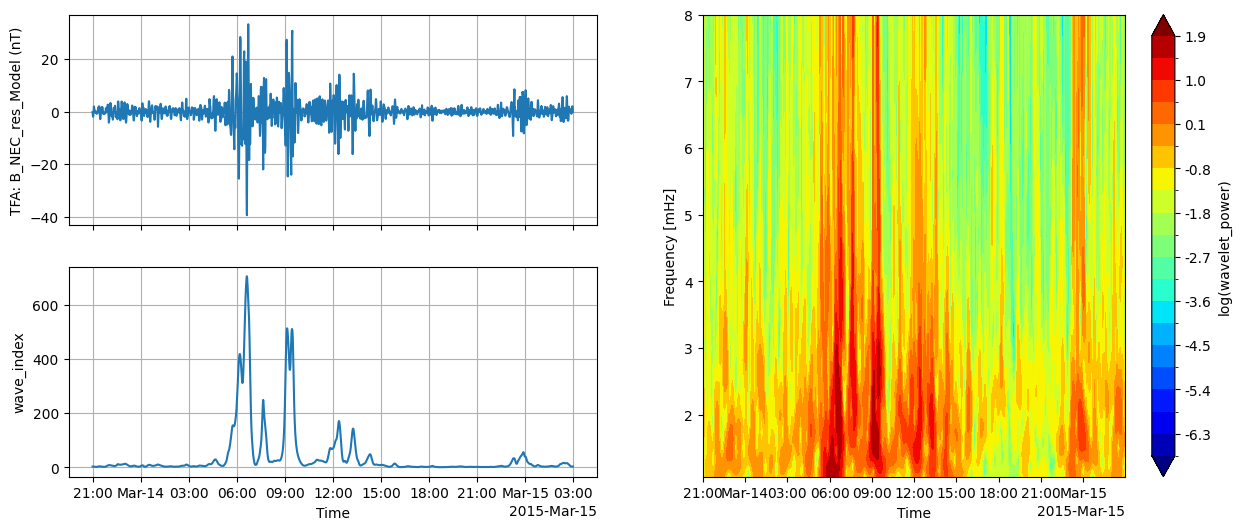
Here we access the 1-minute data (the “M” in OBSM2_) from Hornsund (HRN). The three-letter code is an INTERMAGNET observatory code (see https://intermagnet.github.io/metadata/#/imos).
Since this is only 1-minute time resolution, only the very low frequency bands can be found (i.e. Pc5).
data_params = dict(
    collection="SW_OPER_AUX_OBSM2_:HRN",
    measurements=["B_NEC"],
    models=["Model='CHAOS-Core'+'CHAOS-Static'"],
    auxiliaries=["MLT"],
    start_time=dt.datetime(2015, 3, 14, 0, 0, 0),
    end_time=dt.datetime(2015, 3, 14, 23, 59, 59),
    pad_times=(dt.timedelta(hours=3), dt.timedelta(hours=3)),
    server_url="https://vires.services/ows",
    options=dict(asynchronous=False, show_progress=False),
)
data = create_paldata(PalDataItem.from_vires(**data_params))
Accessing INTERMAGNET and/or WDC data
Check usage terms at ftp://ftp.nerc-murchison.ac.uk/geomag/Swarm/AUX_OBS/minute/README
Processing#
p1 = tfa.processes.Preprocess()
p1.set_config(
    dataset="SW_OPER_AUX_OBSM2_:HRN",
    active_variable="B_NEC_res_Model",
    active_component=0,
    sampling_rate=1 / 60,
    remove_model=True,
)
p2 = tfa.processes.Clean()
p2.set_config(
    window_size=10,
    method="iqr",
    multiplier=1,
)
p3 = tfa.processes.Filter()
p3.set_config(
    cutoff_frequency=0.001,
)
p4 = tfa.processes.Wavelet()
p4.set_config(
    min_scale=1000 / 8,
    max_scale=1000 / 1,
    dj=0.1,
)

p1(data)
p2(data)
p3(data)
p4(data);
Plotting#
Note that since the ground station data are provided in a 1-minute sampling time, the frequency range to be studied must be very low, i.e. Pc5 (2 - 7 mHz). Frequencies higher than 8 mHz cannot really be captured with these data, since the Nyquist frequency for a sampling time dt of 60 seconds is 1/(2*60) = 8.33 mHz!
tfa.plotting.quicklook(data, extra_x=("MLT",));