Analysis of Cluster data#
In this example we will access Cluster data via a HAPI server (not from VirES)
For more information about HAPI, see http://hapi-server.org/
import datetime as dt

from swarmpal.io import create_paldata, PalDataItem
from swarmpal.toolboxes import tfa
Fetching data#
We can access HAPI data in an almost identical way as from VirES, instead using PalDataItem.from_hapi.
Here we will use the AMDA service to get the data. This might change in the future.
Available HAPI data can be browsed at http://hapi-server.org/servers, to quickly look at the data or to generate code snippets using the Python hapiclient package - the inputs to hapiclient can be used in PalDataItem.from_hapi (hapiclient is used underneath within SwarmPAL). For example:
data_params = dict(
    server="https://csatools.esac.esa.int/HapiServer/hapi",
    dataset="C3_CP_FGM_SPIN",
    parameters="B_vec_xyz_gse",
    start="2015-03-29T17:00:00",
    stop="2015-03-29T19:00:00",
    pad_times=(dt.timedelta(hours=3), dt.timedelta(hours=3)),
)
data = create_paldata(PalDataItem.from_hapi(**data_params))
print(data)
<xarray.DataTree 'paldata'>
Group: /
└── Group: /C3_CP_FGM_SPIN
        Dimensions:        (time_tags: 6839, B_vec_xyz_gse_dim1: 3)
        Coordinates:
          * time_tags      (time_tags) datetime64[us] 55kB 2015-03-29T14:00:02.868000...
        Dimensions without coordinates: B_vec_xyz_gse_dim1
        Data variables:
            B_vec_xyz_gse  (time_tags, B_vec_xyz_gse_dim1) float64 164kB 25.18 ... -3...
        Attributes:
            PAL_meta:  {"analysis_window": ["2015-03-29T17:00:00", "2015-03-29T19:00:...
Processing#
p1 = tfa.processes.Preprocess()
p1.set_config(
    dataset="C3_CP_FGM_SPIN",
    timevar="time_tags",
    active_variable="B_vec_xyz_gse",
    active_component=2,
    sampling_rate=1 / 4,
)
p2 = tfa.processes.Clean()
p2.set_config(
    window_size=300,
    method="iqr",
    multiplier=1,
)
p3 = tfa.processes.Filter()
p3.set_config(
    cutoff_frequency=0.1,
)
p4 = tfa.processes.Wavelet()
p4.set_config(
    min_frequency=1,
    max_frequency=25,
    dj=0.1,
)

p1(data)
p2(data)
p3(data)
p4(data);
Plotting#
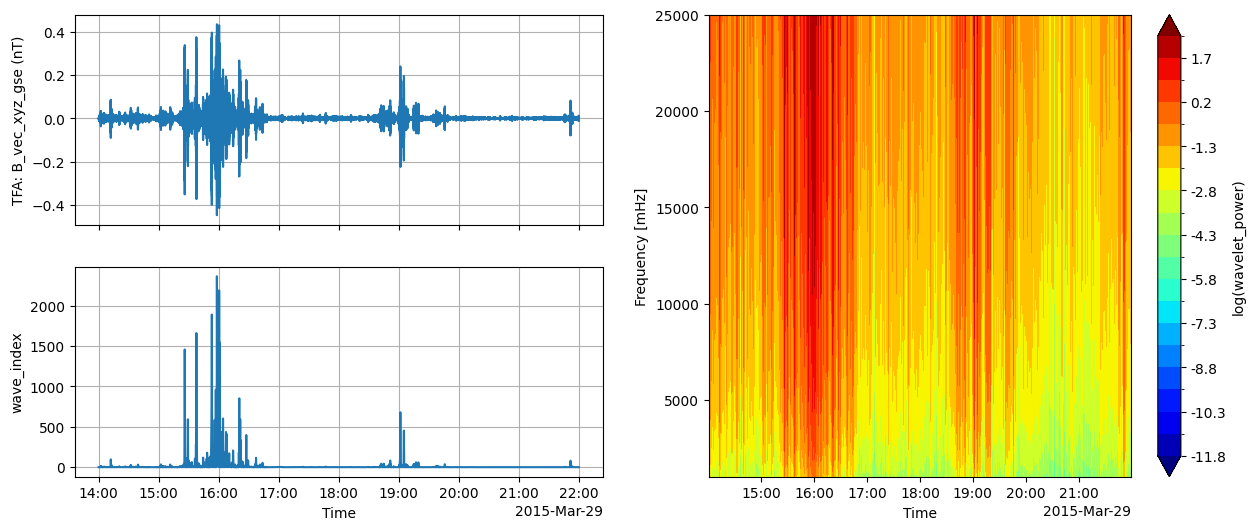
tfa.plotting.quicklook(data, extra_x=None);